Blobs
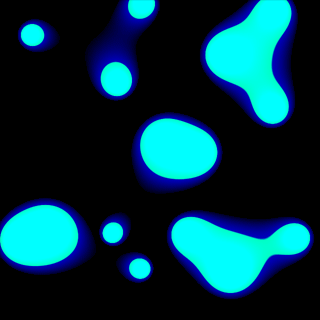
Smooth, fast morphing blobs which seem to be able to attract eachother and link up sound like they could be a challenge to code - but are in fact dead simple. Ridiculously so, actually!
Puzzling them out
I'll have to confess - that image at the top of the page is not a straight screenshot. It's a number of screenshots tiled together - in reality my demo only deals with 3 blobs, though it's easy enough to add more to it. So, what seems to be going on?
Let's ignore the blue glow around each blob for the moment and concentrate on the green body for the moment. Each pixel on the display seems to be coloured relative to the distance away from the centre of each blob it is. That is, a pixel that falls over the centre of a blob is bright, stays quite bright for a fair range over the surface of the blob then falls off very quickly towards the edges until it is dark.
Look closely at the picture again. The brightness is clearly not a linear relationship to the distance, else it would fall off smoothly, and not have that sharp cut-off point. We could clip it, so if it's less than (say) half brightness then we set it to black. However, that would lead to jagged pixel edges and unsmooth fades to black, and the edges here certainly fade smoothly to black.
The idea here is to use a relationship of the distance squared. "Ah", you might say, "that would still leave us with fuzzy blobs". What we need to do is use a pretty sharp curve and clip the range of brightnesses. Here's a sketch of what I mean: note that the curve is flipped upside down to how you'd normally see a graph of y = x2.
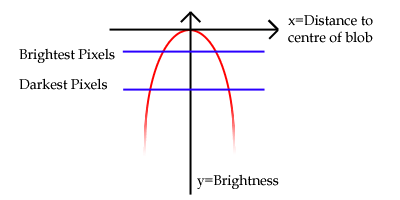
The red curve is our distance2 curve. The vertical y axis indicates the overall brightness. The horizontal x axis indicates the distance from the pixel to the centre of a blob, with the point where they cross being the brightest (distance = 0). We clip the brightness returned between a minimum and a maximum value - demonstrated here by the two blue lines.
Maths!
Those of you who like maths should be happy - this is an effect that requires more maths than code. Those who don't like maths shouldn't worry too much though - it really is very simple.
Calculating the distance between two points is done using a thereom by Pythagoras. It runs:
distance = square root((x1-x2)2+(y1-y2)2)
...where the two points are (x1,y1) and (x2,y2). We want the distance squared - which is most fortunate as this cancels out the expensive square root operation from the equations. (By "expensive" I mean a function that takes a long time to perform). So now, for each pixel we can compare it to the centre point of the blob and calculate a distance squared. We can then turn this into a brightness - hang on, how are we going to do that?
If you think about it, our distances are going to be smallest on top of the centre of the blob - it'll be zero. As we get further and further away from the centre of the blob the distance2 will get larger and larger. If you start with the brightest value for the pixel then subtract the distance2 value, we'll get the value for the brightness of the pixel that we need to plot to the screen. Of course, you need to check that it's within our range of allowable pixel values (between 0 and 255, for example, in 24- and 32-bit video modes).
I know I'm not a great fan of source, so have some pseudo-source that illustrates what I mean a bit better:
for y is 0 to screen_height - 1
    for x is 0 to screen_width - 1

        // Calculate the distance2:
        distance_squared = (blob_x-x)2 + (blob_y-y)2

        // Turn it into a pixel brightness:
        pixel_brightness = 255 - distance_squared

        // Clip it into the range 0→255:
        if pixel_brightness < 0 then
            pixel_brightness = 0
        end if

        if pixel_brightness > 255 then
            pixel_brightness = 255
        end if

        // Set the pixel on the screen:
        set_screen_pixel(x,y) = pixel_brightness
    next x
next y
Hang on - what about the other blobs?
The cool thing about this effect is the way that the blobs interact with eachother; joining and splitting apart! How do we mix the values together?
The answer is straightforwards - calculate a distance2 value for EVERY blob and multiply them together to get the final value you then convert to a pixel brightness.
To understand this we need to think of a number of specific cases. I hope that what I say is clear enough...
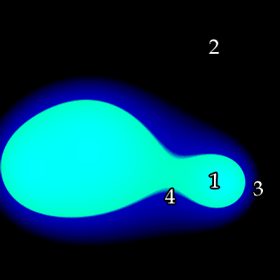
- Near, or very near to the centre of a blob: the distance squared will be 0 - or very close to it - and anything that is multiplied by this will become 0 too. Therefore points that are very close to the centre of a blob will always be bright.
- Far away from any blobs: the distance squared will be very large, and as we multiply it again and again it will only be getting bigger and thus darker.
- Just outside one blob but not near any others: the distance might be fairly small, but because it is a long way from any others their large distance2 values will soon make it too large and thus dark.
- Just outside one blob which is very close to another blob: the distances will be fairly small in all cases meaning that the multiplied value will grow slowly and still be fairly bright.
Implementation
One fairly important thing to bear in mind here is how to avoid a number of pitfalls. For example, the pseudo-code listed above is pretty rubbish - it performs an excessive number of multiplications! Also, I'll try and give some hints on colouring and a bit of troubleshooting help.
Reducing the number of calculations
For every pixel on the screen, we need to calculate the distance to each blob. This distance is calculated by summing x-difference squared and y-difference squared. The blobs are in the same position as you draw the frame. This means that for every row you draw, you are stuck in the same y coordinate and thus can use the same y-difference squared value. What this means is that a better way to operate is:
- For each blob:
- Go through the full range of x-values, calculate the difference between that x and the x coordinate of the particular blob you are looking at. Square it, and save it to a table.
- Go through the full range of y-values, calculate the difference between that y and the y coordinate of the particular blob you are looking at. Square it, and save it to another table.
- For each pixel:
- For every blob, take the x-offset2 and y-offset2 values from the tables you just computed and add them. Multiply all these up.
- Take the brightest pixel value, subtract our total multiplied distance from it, clip it, draw that pixel.
// First: compute those tables:

// Go through every blob
for i is 1 to number_of_blobs

    // Compute the x-offset2 table:
    for x is 0 to screen_width - 1
        x_offset_table(i, x) = (x - blob(i).x)2
    next x

    // Compute the y-offset2 table:
    for y is 0 to screen_width - 1
        y_offset_table(i, y) = (y - blob(i).y)2
    next y
next i


// Now we have those tables, we can use them to calculate the
// total multiplied distance2 value.
for y is 0 to screen_height - 1
    for x is 0 to screen_width - 1

        // Calculate the multiplied distance2:

        // Set it to one initially.
        // This is so that the first time we multiply it
        // by the first value it becomes that value.

        distance_squared = 1

        for i is 1 to number_of_blobs
            distance_squared =
                distance_squared * (x_offset_table(i, x) + y_offset_table(i, y))
        next i

        // Turn it into a pixel brightness:
        pixel_brightness = 255 - (distance_squared / 8589934592)
        // Notice the HUGE division number!

        // Clip it into the range 0→255:
        if pixel_brightness < 0 then
            pixel_brightness = 0
        end if

        if pixel_brightness > 255 then
            pixel_brightness = 255
        end if

        // Set the pixel on the screen:
        set_screen_pixel(x,y) = pixel_brightness
    next x
next y
Sorry that that's quite a large block! Hopefully it makes sense to you as to why we should calculate the x and y offset tables first.
One thing that has changed since last time is that huge number I divide the the distance_squared by. Why am I doing that?
Let's take a situation where we have 3 blobs and a screen resolution of 400 pixels by 400 pixels. The average x offset will be about 200 as well as the average y offset being about 200. For each blob we take the distance2 as the sum of the x-offset2 and the y-offet2 and multiply them all up. In our case, this results in:
(2002+2002)*(2002+2002)*(2002+2002) = 512000000000000
That is not a small number! Seeing as we need to scale our brightness between 0 and 255, it's a pretty rubbish number to try and use, so we divide it down to a more sensible value - in our case:
512000000000000 / 8589934592 = 59604.64
Crumbs, it still looks to be far too large. Fear not, though - using 200 as the average distance is a pretty poor way to judge this. Let's try somewhere closer to home - a point that is 60 pixels away in x and y coordinates from the centre of all 3 blobs. Using the same sum as above, we get:
(602+602)*(602+602)*(602+602) = 46656000000
46656000000 / 8589934592 = 5.43
...and a value of 5.43 (when subtracted from 255) will give us a nice bright colour. Balancing this value so you get a good range of brightnesses is something that can be done with simple fiddling until it looks right. As for the "magic" value of 8589934592 that I seem to have picked out of the air - it's 233, and dividing by powers-of-two can be done with a bit-level shift.
One huge, nasty problem appears here - having variables chunky enough to hold the gigantic values we're building up. Well, we could divide when building our tables (which loses precision), switch to floating point and divide when building the tables (which loses speed) or just use variable types like DWORD64 - which is more than sufficient for our needs. See the "Troubleshooting" section for more information!
Colouring in
This is really a section where you should play around yourself to try and create interesting colours and styles, but I'll demonstrate some options for completeness.
First of all is the obvious approach: subtract our value from 255. This results in blobs like this:
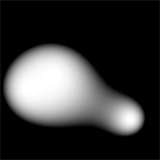
Hmm... not bad, but a bit too fuzzy for my liking. I prefer my blobs to look like real physical blobs of goo rather than bobbing lights. Think back to that picture of the curve all the way back at the start of this article. Remember those blue lines that clipped the brightness into a particular range? Why not try to shift the range of values - in this case, I'll try taking our distance value away from 512 rather than 255, and instead we get this:

Much better! Problem is, as we stretch our values higher and higher we have the unfortunate effect of making the dark bits brighter too and so the blobs get larger. What we need to do is make the cutoff point much sharper - which can be done with a multiplication. Multiply the distance2 by a constant and it makes the whole thing much sharper, reducing the size of the blobs as well. Here's an example where I multiply the total value by 64 before subtracting it from 4096 to get our pixel brightness value:

Of course, adding this extra multiplication step is simple. When we multiply all the distances together in the earlier part of the code, we start off with distance_squared = 1. If I set this to 64 instead of 1 now it has the same effect as multiplying it by 64 later!
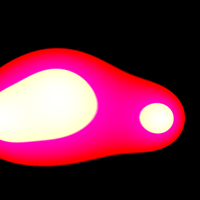
Greyscale blobs are quite dull, really, so making them glow a colour would be nice. Notice how in mine the blob is a greeny blue and glows blue? This is because I am mixing together the RGB value of the colours together by using a bright, sharp, crisp brightness (like the bottom picture) for the G and a dim, smooth, fuzzy brightness for the blue (like the top picture) before writing the pixel to the screen. With a bit of experimentation, you can create some truly odd effects.
Troubleshooting
The major problem with blobs like these is the sheer magnitude of the numbers we're dealing with. Here are the three scenarios that could crop up:
Overflow
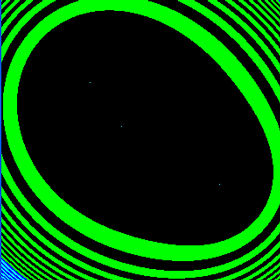
Too big!
In this case, we haven't been dividing our multiplied distances by a large enough value (the 8589934592 above, for example). Hence the three tiny, sharp blobs and the colourful swirls as the number gets so large it wraps around. It could be less obvious than this, though: divide by even less and you could end up with a screen of noise, or just pure blackness. Make sure:
- That you're dividing by a large enough number, and
- That the variable type you are storing the multiplied number in is large enough to hold it without danger of overflowing.
Too large a dividing factor

Too small!
In this case, we have been dividing our multiplied distances by too large a value, meaning that the resulting value is 0 which ends up producing the brightest pixels all over the display. This is a quick fix - just make that number smaller!
Square blobs
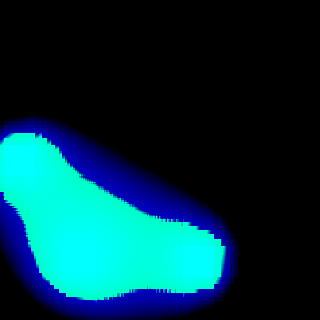
No, that's not a low-quality JPEG.
This is a precision problem. Dividing your tables by a constant value to reduce the overall value might sound like a good idea in theory, but will usually result in odd-looking effects like the above. Use the straight values instead...