Debugging fun
Monday, 22nd May 2006
One part of the Latenite 'suite' that's needed some dire attention is the PindurTI interface. This talks to the excellent TI emulator via a non-interactive mode, and can therefore sit between Latenite (and your source code) and the emulated calculator (which is running your binary).
The current incarnation of this tool is very primitive - you have a calculator that you can run/pause and send files to. That's it.
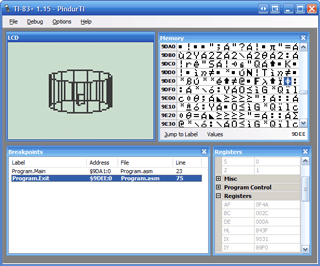
A picture should illustrate what the new one's like and what the old one was missing:
There's a memory viewer, register viewer, and breakpoint window. Breakpoints are caught and highlighted in the breakpoint window.
Currently, there is no editing of the calculator state - PindurTI has yet to support writing back the status (it can only dump it at the moment). All the breakpoint and label information comes from the debug file exported directly by Brass.
